The Power BI file can't be published because of university restrictions, so this page shows screenshots of the dashboard and a written walkthrough instead. The retailer and data are a course case study, not a real client.
The problem
Sales were growing, but profit wasn't keeping up
The business sells furniture, office supplies and technology. Between 2014 and 2017 sales rose from $484K to $733K and profit from about $50K to $93K. In 2017 sales grew by 20.4%, yet the profit margin slipped from 13.4% to 12.7%.
Acting as the data analyst, I was asked three things: where is the business losing profit, why is it happening, and what should it change first?
My contribution
This was an individual project. I cleaned and modelled the data, designed and built the dashboard, and carried out and wrote up the analysis, including the recommendations.
Tools and method
Cleaning, modelling and building the report
- Cleaning in Power Query: removed title rows above each sheet's headers, promoted headers, set data types and removed duplicate postal codes from the region table.
- Fixing a key problem: 32 Product IDs appeared under more than one product name, so I built a product key from the ID and the name to keep products distinct.
- Star schema: one Sales fact table linked to Customers, Geography, Orders, Products and Calendar dimensions.
- Analysis columns and measures: a Discount Band column (no discount, up to 20%, over 20% to 40%, over 40%) and measures for sales, profit, margin and average discount.
- Dashboard: three pages (Overview, Products & Discounts, Regions & Customers), a hidden drill-through page for product detail, and four synced slicers for year, region, category and segment.
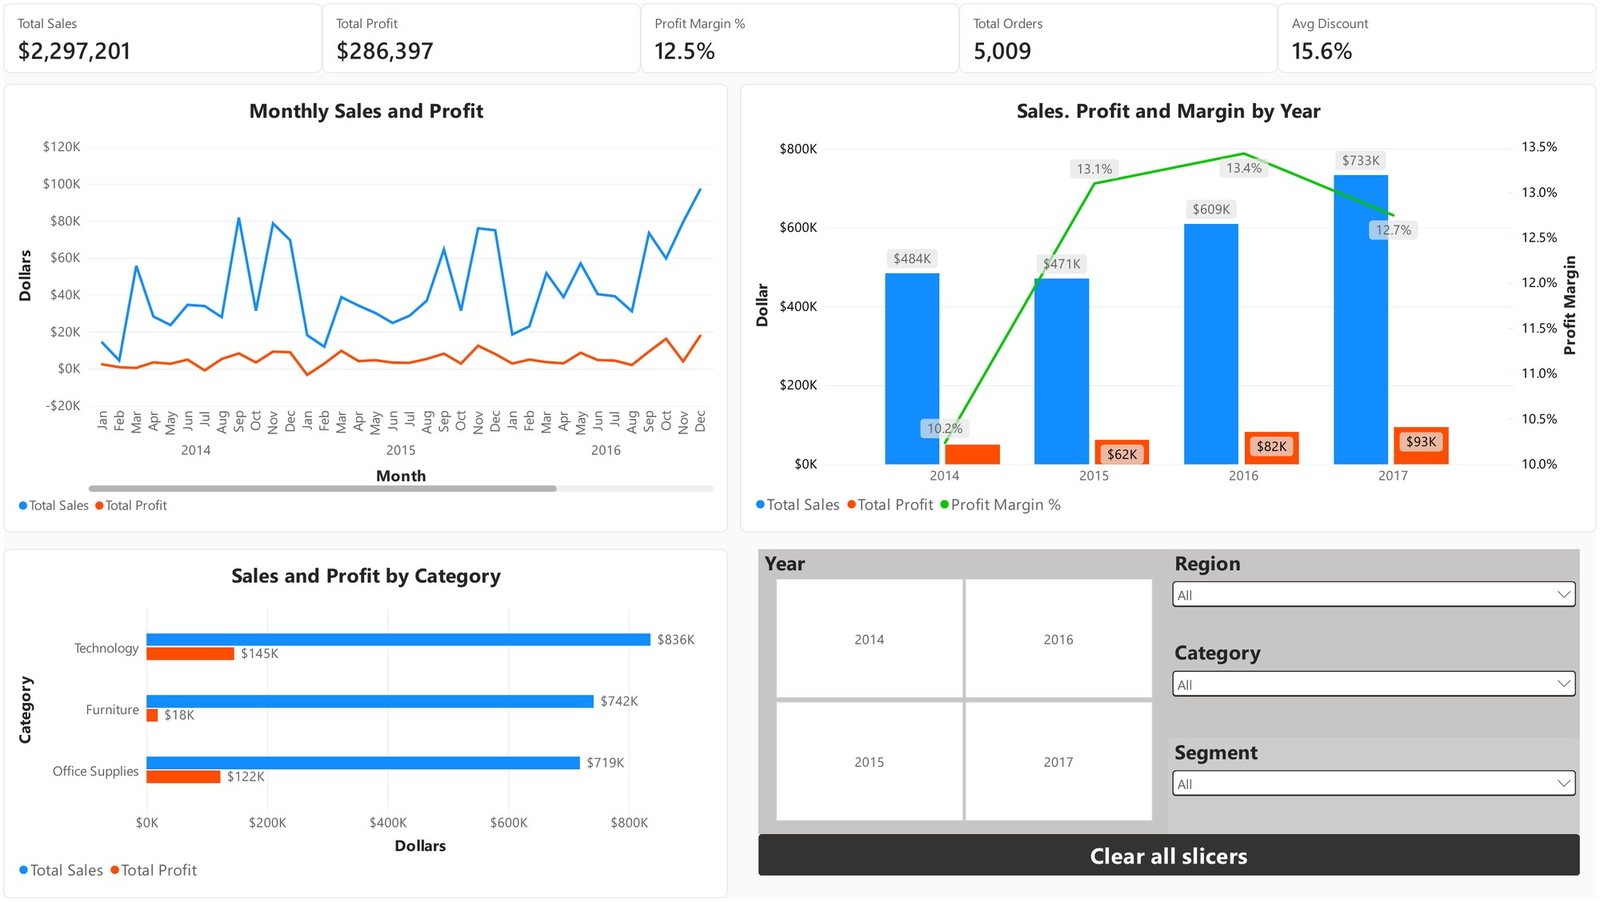
Process and decisions
1. Which products lose money?
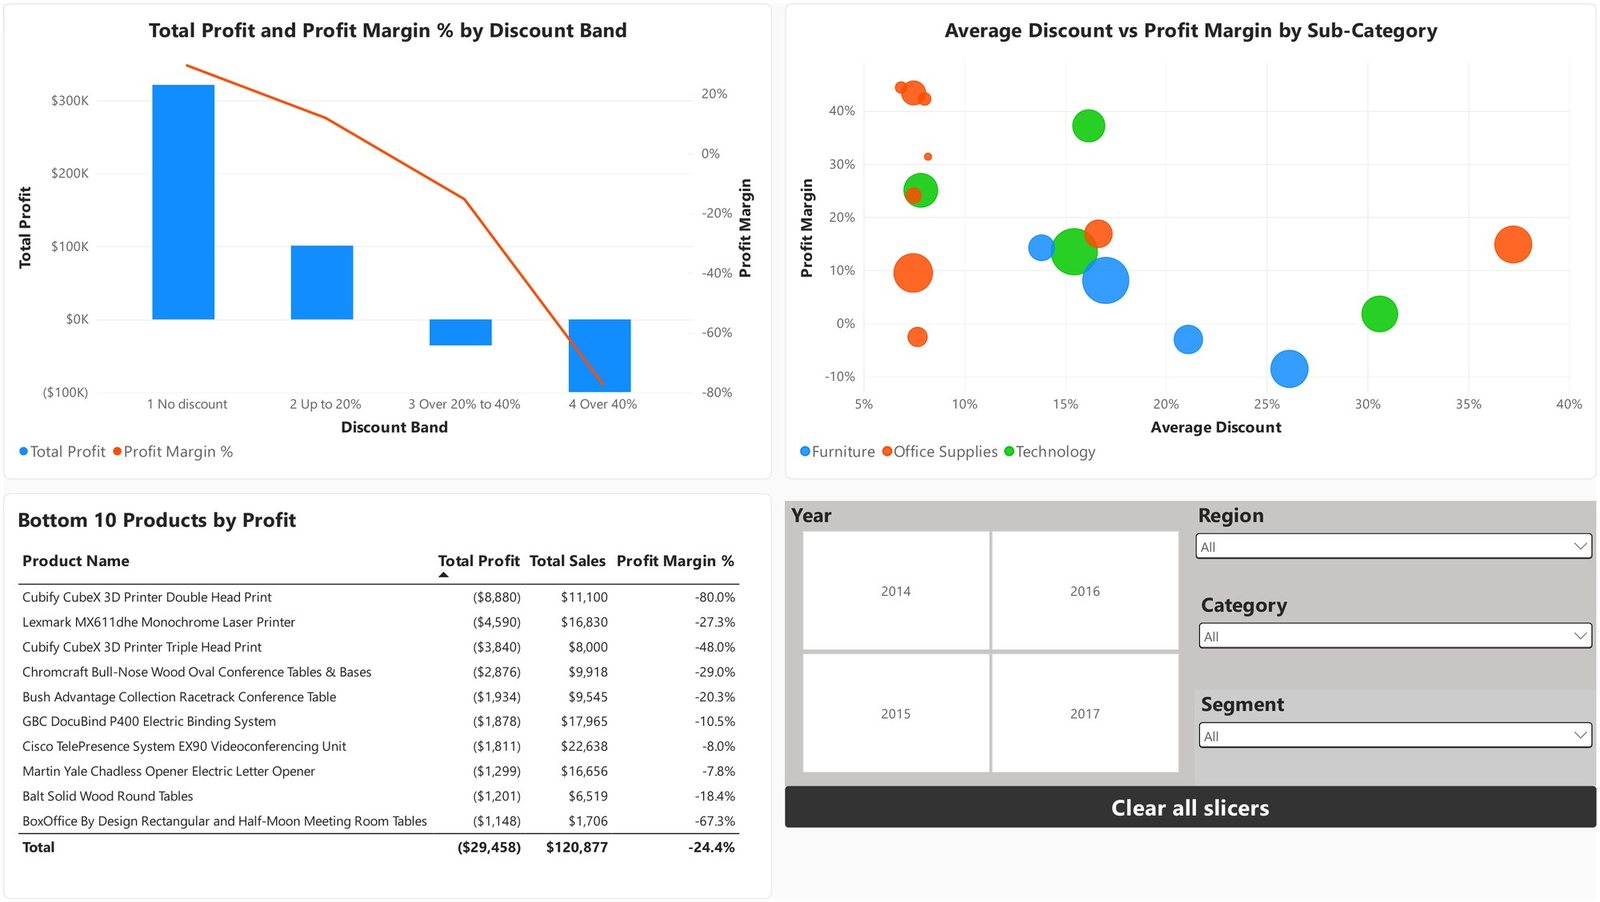
Furniture is 32% of sales but only about 6% of profit, a margin of 2.5% against roughly 17% for Technology and Office Supplies. Within Furniture, Tables sold $207K at a loss of 8.6% and Bookcases also lost money. The ten worst products together lost $29,458, and four of them are tables. The worst single item, a 3D printer, sold in only three orders, so I used drill-through to confirm it was a handful of badly priced sales rather than a pattern.
2. Why is it happening?
The scatter chart suggested heavy discounting, but Binders are discounted at 37% and still earn about 15%, so discount alone wasn't the full answer. To test it properly I grouped every order line into discount bands. The result was clear:
- No discount: 29.5% margin
- Up to 20%: 11.9% margin
- Over 20% to 40%: a 15.3% loss
- Over 40%: a 77.4% loss
Lines discounted above 20% lost $135,376. Without those losses, the margin would have been 18.4% instead of 12.5%. Using the year slicer, the share of lines discounted that heavily stayed at about 14% every year, but the loss on them rose 52% from 2016 to 2017. As sales grew, the deep-discount lines grew with them, which is the most likely reason margin fell while sales rose.
3. Where is it happening?
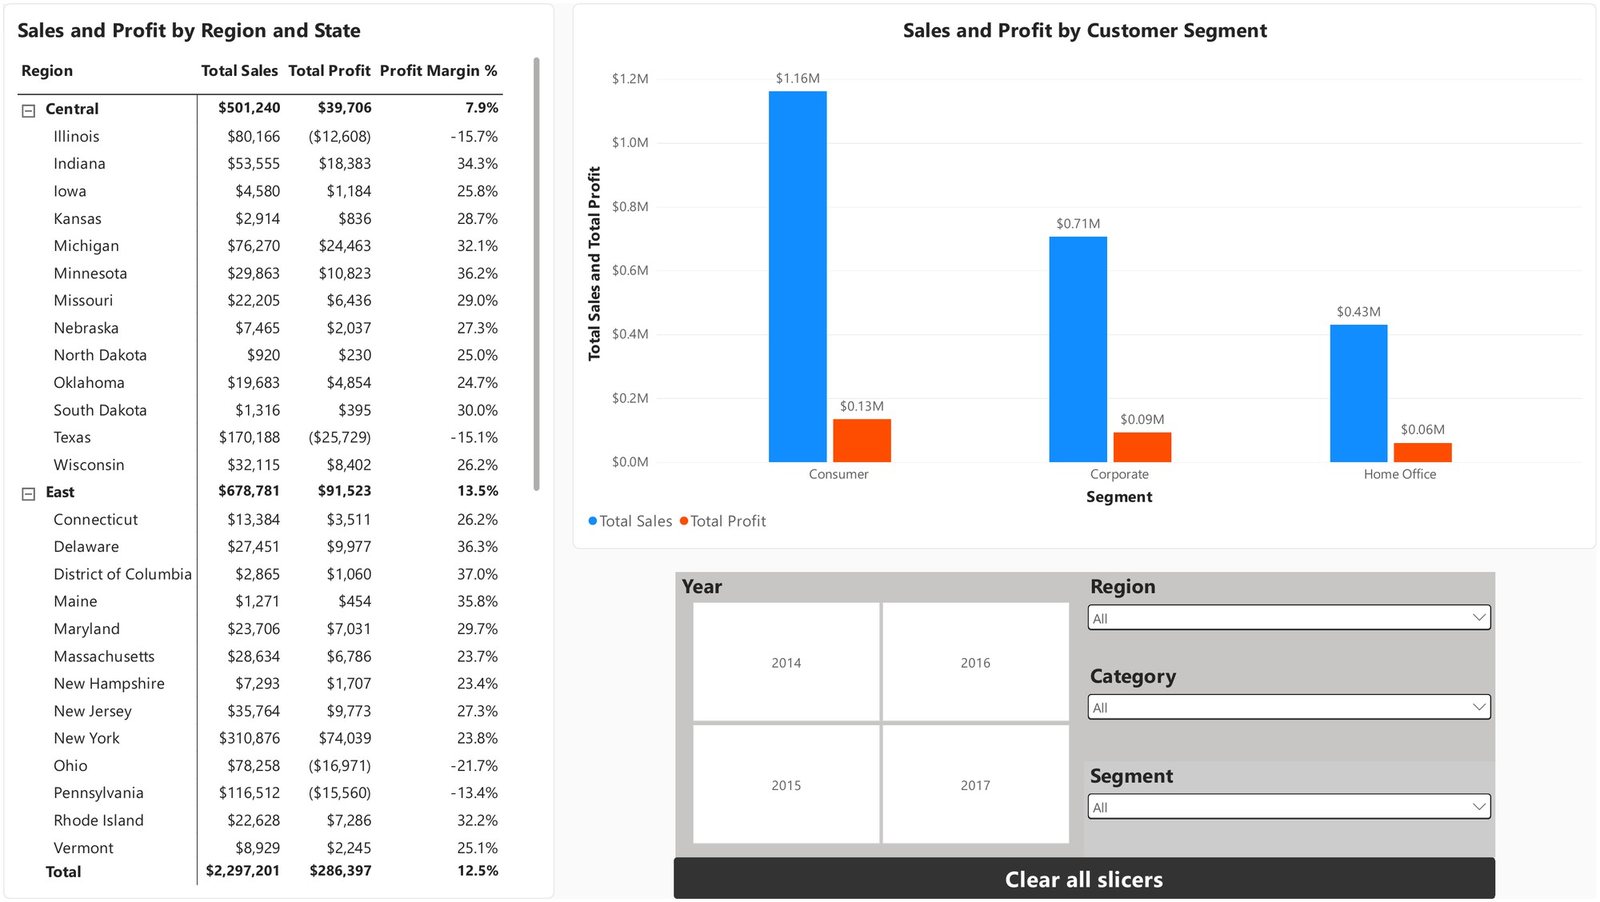
The Central region earns a margin of only 7.9%, against 14.9% in the West, and its average discount is 24% compared with 11%. Expanding the region table into states showed four heavy losers: Texas, Ohio, Pennsylvania and Illinois, which together lost about $70,900 with average discounts of 32% to 39% against 15.6% for the whole business. Tables show the same pattern by region: a 37% average discount and a 28% loss in the East, against a 20% discount and a small profit in the West. Customer segment margins were similar (11.5% to 14.0%), so customer type wasn't the driver.
Results
What I recommended
| Decision | Evidence |
|---|---|
| Put a 20% discount guardrail in place, with manager approval above it | The 1,393 lines discounted above 20% lost $135,376. |
| Reprice or stop discounting Tables, Bookcases and the two worst 3D printers | These lost about $33,900 combined. |
| Audit discount approvals in Texas, Illinois, Ohio and Pennsylvania | The four states lost about $70,900. |
| Direct growth spending to Technology, Office Supplies and the West | Margins of 17.4%, 17.0% and 14.9%. |
I treated the dollar figures as upper limits, not forecasts, because cutting discounts would also cost some sales. A more cautious scenario fixing only the lines discounted above 40% lifts margin to 16.8%. I suggested trialling the guardrail in the Central region for one quarter before rolling it out. I also rejected cutting Furniture entirely, since that would remove profit and leave the same discounting habit elsewhere.
The deliverables were the three-page Power BI dashboard and a written analysis of about 1,300 words.
What I learned
- Total sales growth can hide a margin problem, so profit and margin need to sit next to sales on every page.
- Slicers are a quick way to test an idea, such as checking whether discounting explained the 2017 margin slip.
- The analysis shows association, not proof of cause. The database had no product cost, marketing or stock data, so I couldn't explain why Tables cost so much to sell.
- Clean keys matter. The duplicate Product IDs would have mixed up products if I hadn't caught them in Power Query.